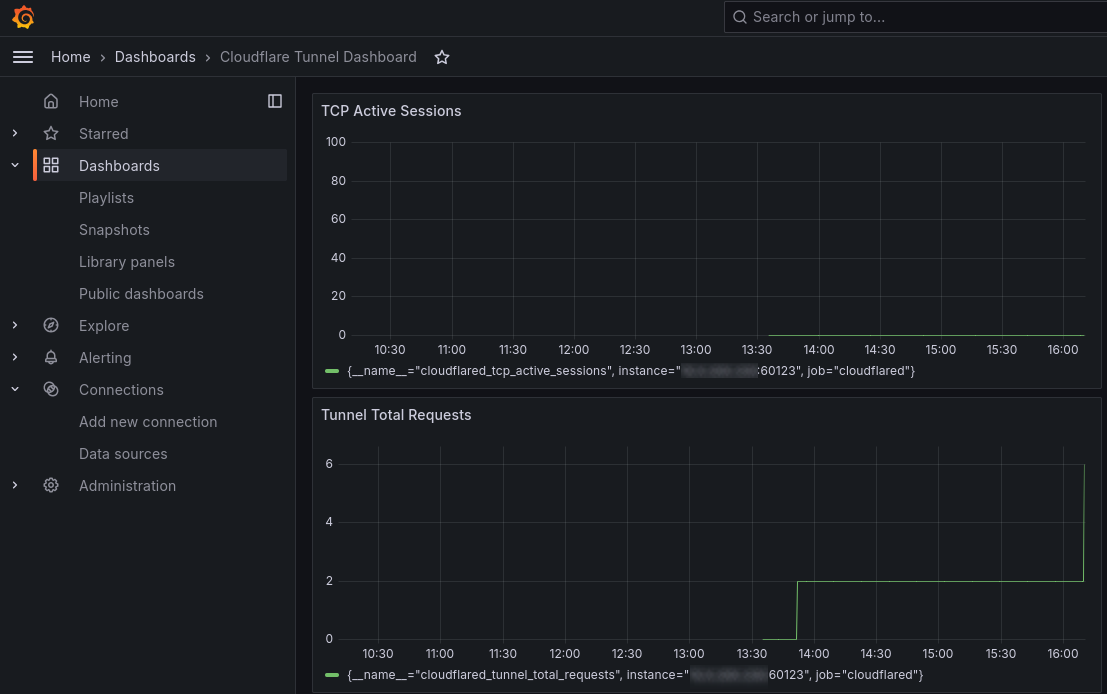
So I figured I'd give this Cloudflare Tunnel monitoring with Grafana tutorial here
The first step is to create a tunnel in Cloudflare! This was all done with a free account which is wonderful. To create a tunnel I used the "dashboard" method instead of the cli by following these steps here.
Then we need to install the cloudflared package on the server we want to expose through the tunnel. I was using Ubuntu Server 24.04 (Noble) which required a little configuration change to get the package working. Here were the steps I followed to install the cloudflared package:
curl -fsSL https://pkg.cloudflare.com/cloudflare-main.gpg | sudo tee /usr/share/keyrings/cloudflare-main.gpg >/dev/null
echo "deb [signed-by=/usr/share/keyrings/cloudflare-main.gpg] https://pkg.cloudflare.com/cloudflared $(lsb_release -cs) main" | sudo tee /etc/apt/sources.list.d/cloudflared.list
Since this will use the Noble release, it won't work when you install cloudflared because there is no Noble package yet! So I went in and changed the release to jammy which does exist. You will need to edit the /etc/apt/sources.list.d/cloudflared.list file and replace 'noble' release with 'jammy'

Once updated to jammy, you can update and install the package:
sudo apt-get update && sudo apt-get install cloudflared
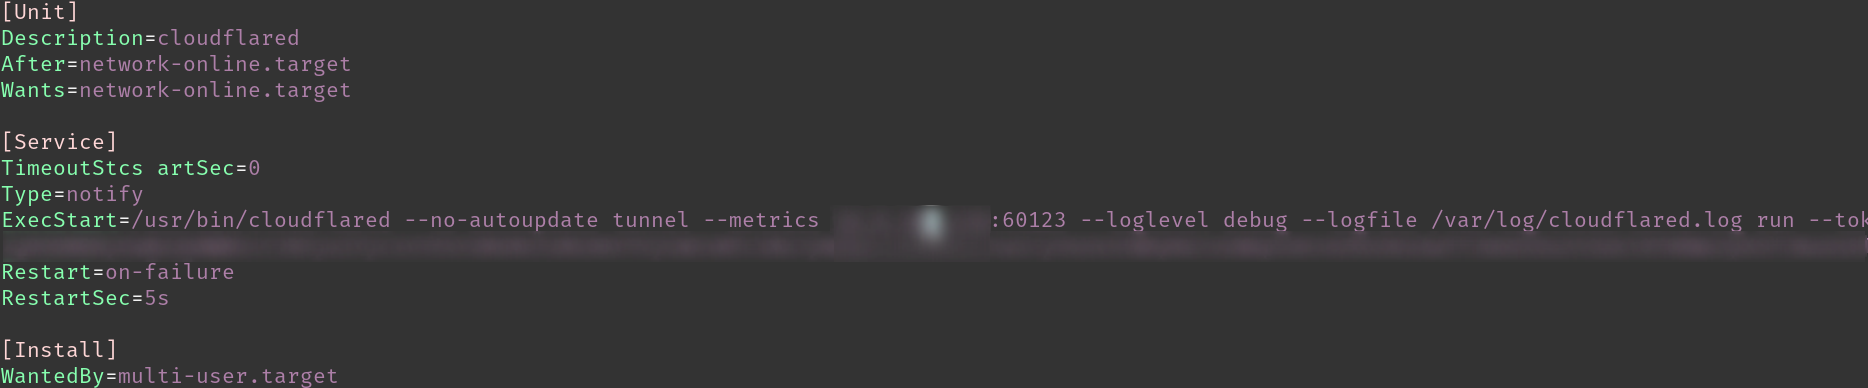
Then once cloudflared is installed you can grab the command from "Install and run a connector" section on the Name your tunnel > Install connector page. It will be "sudo cloudflared service install YOURTOKENHERE" with your unique token for the tunnel. To run cloudflared as a service, create a service file in /etc/systemd/system/cloudflared.service with these contents:
[Unit]
Description=cloudflared
After=network-online.target
Wants=network-online.target

[Service]
TimeoutStcs artSec=0
Type=notify
ExecStart=/usr/bin/cloudflared --no-autoupdate tunnel --metrics 10.0.200.230:60123 --loglevel debug --logfile /var/log/cloudflared.log run --token YOURTOKENHERE
Restart=on-failure
RestartSec=5s

[Install]
WantedBy=multi-user.target
It should look like this:
Then I installed Prometheus onto the same server and added the suggested lines to the bottom of prometheus.yml replacing with my IP target:
  - job_name: "cloudflared"
    static_configs:
      - targets: ["198.168.1.1:60123"] ## cloudflared server IP and the --metrics port configured for the tunnel
Then started Prometheus
./prometheus --config.file="prometheus.yml"
Then opened prometheus on port 9090 and confirmed the "cloudflared_tunnel_total_requests" expression showed as a metric.
Then we need to install Grafana.
Started it as a service and checked the status:
sudo systemctl daemon-reload
sudo systemctl start grafana-server
sudo systemctl status grafana-server
Then we need to "Add new data source" in Grafana and enter the IP address and port 9090 of our Prometheus server and save. Then go to Dashboards, New Dashboard, and add a visualization. Select Prometheus and you can use the same metric we used before or select others to add to the dashboard.
In the end you should have metrics exporting through Prometheus to be displayed in your Grafana Dashboard